Microsoft keeps publishing reminders of an underrated truth. The two on my desk: last November’s annual Performance Improvements in .NET 10 deep dive, which catalogs hundreds of runtime and library optimizations in one very long post, and July’s .NET 11 Preview 6 announcement, which previews runtime-native async and faster NativeAOT dispatch for the release expected this November. Taken together, they make a case most backlogs ignore: the cheapest performance work available to you has already been done by someone else. It ships as a version number.
This is how I read a release like that for a production system. My reference points are my own systems, including a multi-tenant SaaS backend serving roughly 2k requests per second, but the method is stack-agnostic; the examples are .NET because that is where I live.
Free performance is not free to claim#
There are two ways to waste a runtime release. The first is never taking it: staying two versions behind means every optimization in those posts is performance your servers do without, which you compensate for with hardware. The second is subtler: upgrading, reading the release notes, and repeating their numbers as if they were yours. Stephen Toub says it himself in the .NET 10 post: these are microbenchmarks, results depend on hardware and workload, and you should not expect your results to match his. Both failure modes have the same root: treating the release notes as a result instead of as a starting point.
Map the release to your hot paths#
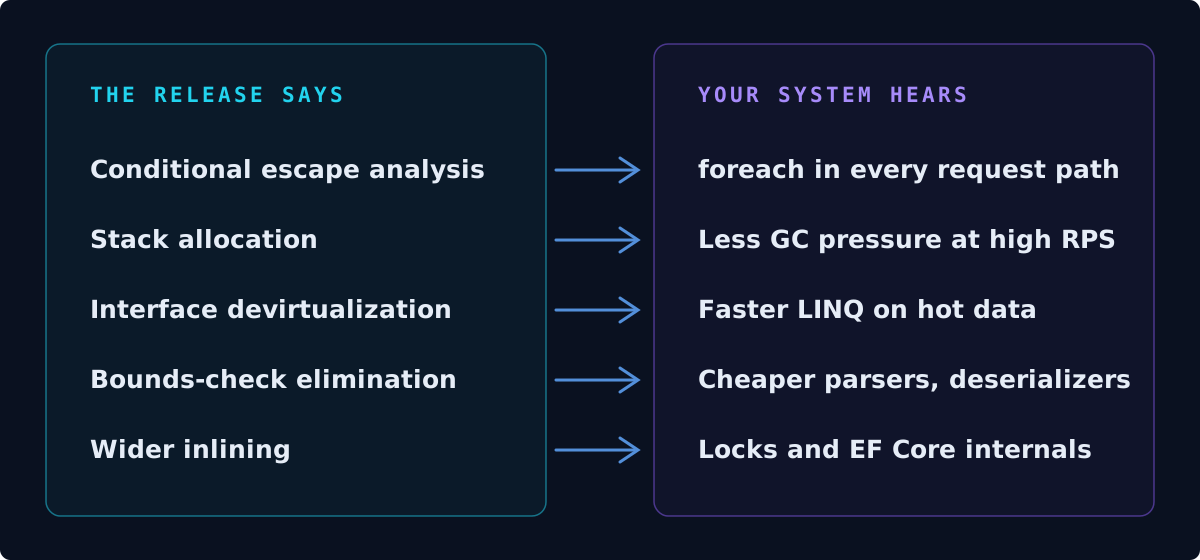
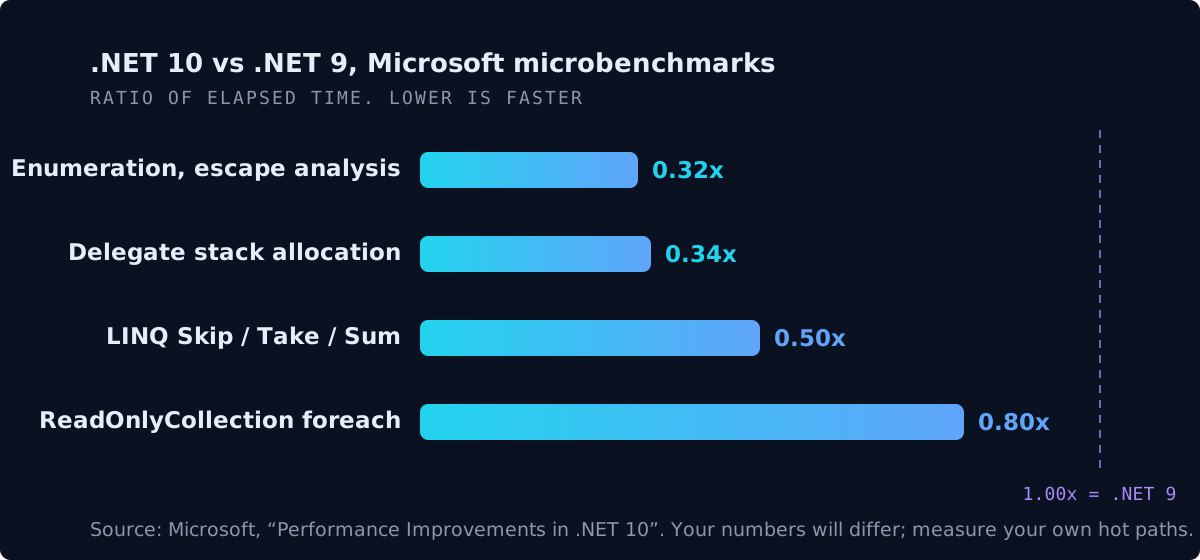
Reading hundreds of optimizations is only useful through a filter, and the filter is your hot paths. Mine are an HTTP and gRPC request pipeline, JSON and Kafka deserialization, EF Core over SQL Server, and background consumers fanning out events. Here is how the headline .NET 10 work maps onto that shape. The numbers are Microsoft’s published microbenchmarks (linked above), not my measurements:
| .NET 10 change | Where it lands in a high-RPS service | Microsoft’s benchmark |
|---|---|---|
| Conditional escape analysis (with PGO) | foreach over collections in every request path; fewer heap allocations under load | Enumeration at a 0.32x ratio, with the allocation eliminated |
| Delegate and array stack allocation | Lambdas in middleware and LINQ; less GC pressure at sustained RPS | 0.34x ratio; 88B per call down to 24B |
| Array interface devirtualization | LINQ over arrays and ReadOnlyCollection | Skip/Take/Sum up to 50% faster |
| Bounds-check elimination (switch, loop cloning) | Parsers, protocol handling, Kafka and JSON deserialization | Six bounds checks reduced to zero in the switch pattern |
| try/finally and generic-virtual inlining | Lock wrappers and EF Core query internals | Previously non-inlinable methods now optimize normally |
The value of this exercise is not the specific rows; it is that each row now names a place in your codebase where a benchmark is worth running. That turns an unreadable catalog into a short work list. Mine has five entries, not five hundred.
Verify on your own workload#
Claiming a gain takes two measurements: one in isolation, one in production. In isolation, I benchmark the named hot paths on both runtimes with BenchmarkDotNet and its MemoryDiagnoser, identical hardware and identical inputs, because allocation deltas are usually the honest signal. In production, the upgrade rides a canary first, and the verdict comes from traces: p99 latency per stage, GC pause time, allocation rate. Averages hide exactly the regressions that matter.
- Benchmark the named hot paths on the old and the new runtime; same machine, same inputs, MemoryDiagnoser on.
- Canary one service and read the verdict from traces (p99 per stage, GC pauses, allocation rate), not from dashboards of averages.
- Only publish a number you have seen twice.
Upgrades change the scaling math#
A verified gain on a hot path is capacity you did not have to buy. I have written before about choosing the axis you scale on; a runtime upgrade quietly moves that decision, because ten or twenty percent off the hot path is replicas you do not add and a database tier you do not grow into yet. For cloud-native systems, where the infrastructure bill is supposed to follow the user curve, a runtime release bends the capacity line down without a migration, a freeze, or a rewrite. It is the rare performance project whose main cost is a regression test.
When not to jump#
Enthusiasm needs a calendar, not a deploy key. Previews are for benchmarks: .NET 11 Preview 6 puts runtime-native async, faster NativeAOT interface dispatch, and new SIMD lane operations on my watch list, and runtime async in particular is worth tracking if you run real-time or backpressure-sensitive code, because it changes the cost model of the async machinery itself. None of that belongs in production before GA. My rule of thumb: previews get a benchmark rig and a calendar entry; GA releases get a canary and then the fleet; LTS releases are the default target the fleet settles on. An upgrade should be an operation, not a project.
What I actually do, in order#
- Read the release performance post the week it lands; extract only the rows that name my hot paths.
- Benchmark those rows on my own workload before believing anything.
- Canary one service, verify in traces, then roll the fleet: GA and LTS only.
- Keep a watch list of preview features (.NET 11 runtime async is on mine) with a benchmark date attached.
- Bank the verified gain in the capacity plan: it is scale nobody had to pay for.
The cheapest performance work in your backlog was already shipped by someone else; your job is to claim it with measurements, not enthusiasm.